What You Need to Know About Creating Strategies for Trading and Finding Inefficiencies
 The issue of optimizing the implementation of trading strategies is devoted to many publications in blogs, articles, and books. At the same time, almost no one writes about how to build such a system from scratch. The author of the Financial Hacker blog decided to correct this situation and create a series of articles on developing trading strategies - we offer you the main points of the first material
Two Main Methods for Constructing Online Trading Strategies
Essentially, there are two main methods for constructing online trading strategies. The first is focused on a specific model, and the second - is on data mining. In the first case, we are dealing with the concept of an inefficient market. The method includes working with the psychology of traders, the economy, the microstructure of markets, as well as any external phenomena that may affect stock prices. Inefficiency leads to price curve anomalies or certain patterns of price fluctuations that can be attempted to be predicted and used in a trading algorithm. Strategies based on a specific model include trend following, mean reversion, price cycles and clusters, statistical arbitrage, and seasonality.
There is a problem here - this model is not realistic. This is a simplified image of reality. This model cannot be proven or disproved. Its reliability can only be justified through its influence on the price curve. The applicability of such a model depends on a certain long-term stability of the actions of the anomalies predicted with its help. It can only be verified through a high-quality testing algorithm.
Data mining in its purest form works differently. It is used to study patterns of price changes and build a specific algorithm based on them. What reasons caused the changes in the market is not so important here. They must continue to operate in the future. This approach led to the emergence of trading systems using self-learning software. In this case, The most popular technique is the selection method, trial and error, the use of candlestick patterns, regression, autocorrelation, the k-means method, neural networks, and decision trees.
The benefits of data analytics are that you don't have to guess about the state of the market. Disadvantage: all these methods usually identify a bunch of random patterns and then generate a bunch of useless strategies. Separating random patterns from those that really influence the state of the market is not an easy task. Currently, there are no known successful trading systems built solely on data analysis.
Who is Smarter: Trader Versus Market
Obviously, no trading system will work without some kind of market inefficiency that could be exploited for profit. But even if inefficiency exists, nothing will work unless it can be exploited, and until well-armed players do it for you. Therefore, you need to be able to conduct operations better than most market participants.
Here are three main hypotheses regarding market inefficiency that you have probably heard of
-
Hypothesis A: Markets operate efficiently. Prices depend on actual events (for example, the publication of company annual reports) and reflect the real value of assets. All traders have complete information and act promptly and rationally. There are no price jumps, changes do not provide data for forecasting. The technical trading system is useless. It will be based on the principle of luck.
-
Hypothesis B: Markets are inefficient, but their inefficiency does not provide an advantage to private traders. Only large firms and hedge funds can exploit such inefficiencies with large capital, fast and expensive hardware, experienced analysts and mathematical experts. Starting to play on their field means turning into easy prey for such companies.
-
Hypothesis C: There is enough market inefficiency to provide enough for everyone. In this situation, the size of companies is no longer an advantage, but a disadvantage. Large firms and hedge funds are too slow. All these resources, including overvalued analysts and overpaid geniuses, are not capable of getting ahead of you if you have learned the rules of the game well.
Few people today still believe in the first hypothesis. Markets do not behave rationally and efficiently. You can give any number of examples. More often than not, the value of companies is far from their “real” value. But even in such a situation, some patterns can be discerned. Markets react quickly and forcefully, following rumors and news. But, if the information is less certain and requires minimal interpretation, the reaction speed is noticeably reduced. Let's look at a typical example of this market behavior:
Swiss Franc Case
In September 2011, the Swiss National Bank set a price cap for the Swiss franc. The idea was to protect the tourism industry and exports against the backdrop of an overvalued exchange rate. The limit is set at 1.20 for the EUR/CHF pair (euro/franc).
In general, a price limit is a very rare step and a very clear example of market inefficiency. All this can be immediately translated into an extremely profitable, almost risk-free trading system. In a normal situation, a strong market reaction can be expected when the EUR/CHF pair approaches the 1.20 value. But in practice, the reaction was greatly extended over time.
Of course, Switzerland is a strange place on the map of Europe. Most US trading companies only know that quality cheese is made here. Either they did not notice the decision of the National Bank, or the European offices of these companies forgot to report it. The letter with the news traveled across the Atlantic Ocean for three months, fighting pirates, storms, and storms along the way, until it finally reached New York.
So what can you do if you know about the price limit? Only by January 2012 did major players in the market come up with an idea. And it was not about developing a trading system, it was about simply buying francs to put pressure on the ratio of the EUR/CHF currency pair.
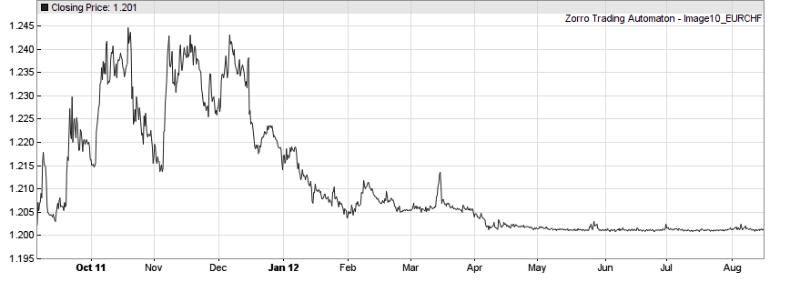
Changes in the price of the EUR/CHF pair in September 2011 – August 2012
The idea was that when the price reaches its limit value, profit can be obtained by breaking through it. A lot of money, patience, and effort were at stake. Since May 2012, the EUR/CHF price has remained extremely close to 1.20. But the collapse of the price cap never happened. During 2012, Switzerland built a mighty $200 billion wall to protect its price cap. All attacks were repulsed. In January 2013, the raiders retreated.
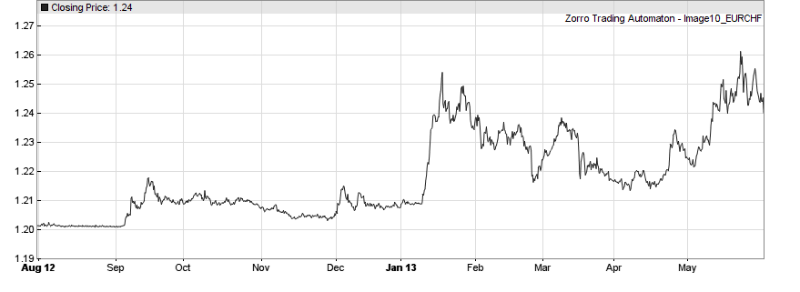
Changes in the price of the EUR/CHF pair in September 2012 – May 2013
They retreated, clearing the way for the work of algorithmic systems. During the 2012 battle, they were forced to remain on the sidelines. Private traders did not have as many funds to enter the game. In January 2013, the first craftsmen began to use market inefficiencies to their advantage. They applied the Grid Trade method, a strategy based on the wave nature of the market, making money on volatility and not depending on the price direction. This started the money printing machine.
Algorithm "Printing Press"
The grid is a very simple system. It places pending and short-term orders at fixed values above and below the current price. Profit is obtained when the market deviates. Orders are opened and closed when the price crosses the grid values in any direction. Hypothetically, the winning rate here is close to 100%, but in practice, this level is impossible to achieve. Traders typically use a virtual hedge that opens and closes a position instead of opening a new one in the opposite direction. This increases overall profits and helps control losses. So the winning percentage here fluctuates in practice around 60%.
The grid is a typical model-oriented system. It implies that certain market conditions keep the price within a certain range. For example, the limit prevents the EUR/CHF pair from falling below 1.20. But the price cannot rise too high either, given the fact that the Swiss National Bank will have to eventually buy back all the francs they sold to maintain a certain value. All these are necessary conditions for using the Grid. Without them, it would be ordinary roulette, and would add to the list of irrational trading methods.
Here is an example of applying the method for the EUR/CHF pair from P&L in 2013:
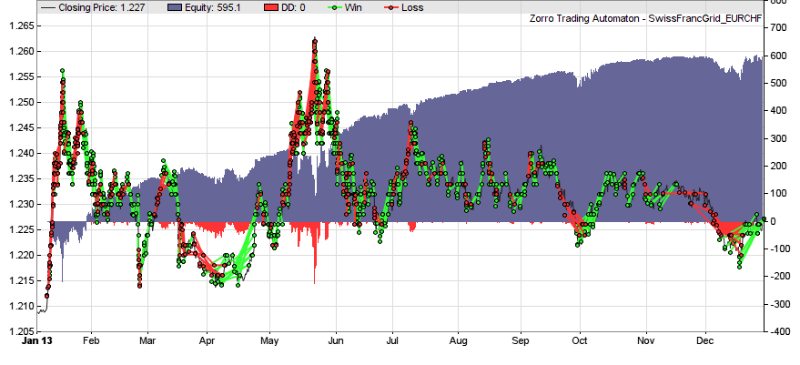
The chart shows significant price fluctuations with significant decreases in January and May. However, due to the existing limit, we can predict the maximum losses and simply keep enough funds in the account. In this case, the annual revenue was 130%, the Sharpe ratio was 1.7. There is virtually no risk until the price cap is lifted.
News about this strategy spread throughout 2013. It is not surprising that many market participants and private investors wanted to jump on the outgoing train. Three years after the decision of the Swiss Bank, thousands of similar systems were already operating on the market. As a result, the volatility of the EUR/CHF price has steadily decreased.
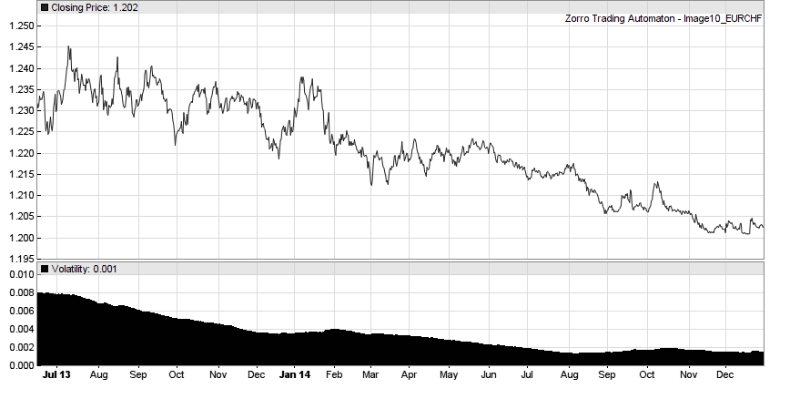
Volatility is a key condition for the Grid method. The less it is, the less income. To compensate for its decrease, you need to invest more money and compress the grid. But we have a natural limit. The grid size cannot be less than the payout on the transaction. By the fall of 2014, volatility had dropped to virtually zero. This was accompanied by a significant drop in price as if one of the major players (most likely the Swiss National Bank itself) was persistently selling euros and buying francs in anticipation of a major event. For private traders, it's time to get out of the game. The further fate of the Swiss franc is well known to everyone. In January 2015, the price restriction was lifted.
In a couple of minutes, the EUR/CHF price dropped to values significantly below 1.20. Unlike the situation four years ago, the market reacted instantly. Many were injured. The most interesting thing is that the “real” ratio of the pair, based on the relative purchasing power of each of the currencies, remained at 1.50 all this time.
Conclusions
- Financial markets react instantly and hysterically to any news with clear indications of price movements up or down.
- Markets react slowly to any information that requires minimal interpretation. It may take years before they realize there is a new inefficiency or strategy.
- Markets prefer brutal, frontal methods of attack. Complex strategies are used by a small number of participants.
- Simple systems that rely on obvious inefficiencies can be useful over a limited time frame.